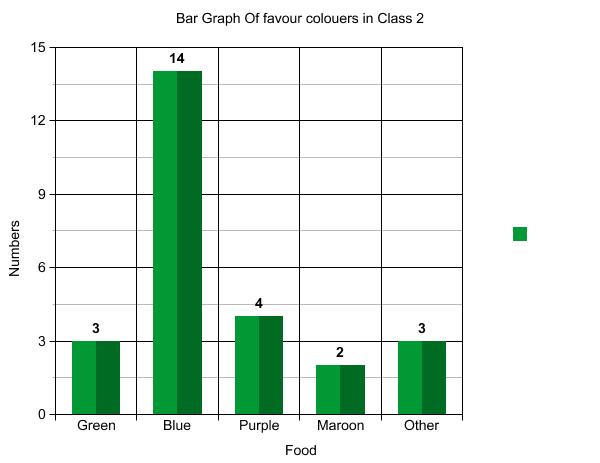
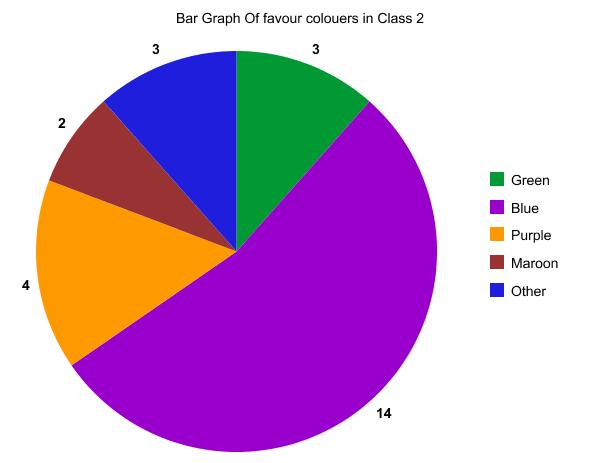
In class two we have been interviewing our students trying to find out what is the most popular colour. After interviewing the students we tally up all the colours. Next we created graphs in Create a Graph. We created three Graph, A Line, Pie and Bar.
We found out 14 students like the colour Blue and only 2 people like Maroon. 7 people like butter chicken and 2 people like noodles.
No comments:
Post a Comment